How to Easily Analyze Crypto Charts for Successful Trading
- 07/14/2026 05:36am
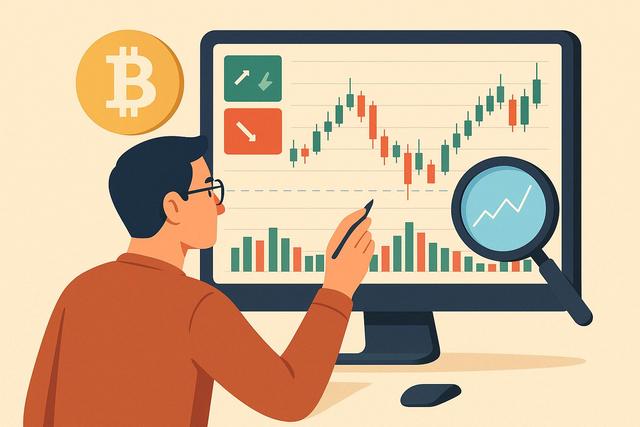
Understanding how to analyze crypto charts is crucial for anyone involved in cryptocurrency trading. In this guide, we will break down the essentials and provide you with the tools to make better trading decisions.
Understanding Crypto Chart Basics
Before diving into detailed analysis, it's important to familiarize yourself with the basic components of a crypto chart. This includes understanding the types of charts, such as line charts, bar charts, and candlestick charts. Each type provides different insights into price movements and trading volumes.
Types of Crypto Charts
- Line Charts: Best for beginners, these show price trends over time based on closing prices.
- Bar Charts: Displays open, high, low, and close prices, giving more depth than line charts.
- Candlestick Charts: Popular among traders for visual clarity, they show the same data as bar charts but in a more visually appealing format.
Candlestick patterns like Doji, Hammer, and Engulfing can indicate potential market reversals or continuations, making them a favorite among advanced traders.
Identifying Key Indicators
Technical indicators are mathematical calculations based on historical price, volume, or open interest information. They help traders make informed decisions.
Moving Averages
Moving averages smooth out price data to identify trends. They come in two types:
- Simple Moving Average (SMA): The average price over a specific time.
- Exponential Moving Average (EMA): Gives more weight to recent prices, responding faster to price changes.
Relative Strength Index (RSI)
RSI measures the speed and change of price movements, indicating whether an asset is overbought or oversold. A value above 70 suggests overbought conditions, while below 30 suggests oversold.
Bollinger Bands
These bands measure market volatility and price levels where currencies may be overbought or oversold. When prices move outside the bands, it can signal a potential reversal.
Using Volume Indicators
Volume is a powerful tool in analyzing crypto charts. It indicates the strength of a price movement — higher volumes can confirm a trend.
On-Balance Volume (OBV)
OBV combines price and volume to show the total amount of money flowing in and out of a market. Increasing OBV accompanies rising prices, indicating strong upward trends.
Practical Tips for Crypto Chart Analysis
- Simplify Your Charts: Start simple and add complexity as you gain confidence.
- Use Multiple Indicators: Rely on more than one indicator for a well-rounded view.
- Stay Updated with Market News: Events influence market trends. Follow reliable sources like CoinDesk for the latest updates.
Common Mistakes in Analyzing Crypto Charts
Overreliance on Indicators
Indicators are helpful but should not be used in isolation. Relying solely on them without considering market context can lead to false conclusions.
Ignoring Market Trends
Market sentiment plays a crucial role in crypto trading. Failing to consider broader market trends can result in missed opportunities or unexpected losses.
Not Practicing Risk Management
Failing to set stop losses or improperly managing risk can lead to significant losses. Ensure you manage each trade's risk relative to your total portfolio.
FAQs
What is the best chart for beginners?
Line charts are ideal for beginners due to their simplicity and ease of understanding.
How often should I analyze crypto charts?
The frequency depends on your trading strategy. Day traders analyze them several times a day, while long-term investors may check weekly.
Can news affect chart analysis?
Yes, significant news events can cause rapid price changes that are immediately reflected in charts.
Conclusion
Mastering crypto chart analysis is an ongoing journey. By understanding chart types, employing key indicators, and remaining aware of common pitfalls, you can make informed trading decisions. Remain disciplined, practice regularly, and always stay updated with market trends. Start small, test your strategies, and gradually refine your approach for better trading outcomes.

