Mastering Support and Resistance Levels in Trading
- 09/10/2026 05:36am
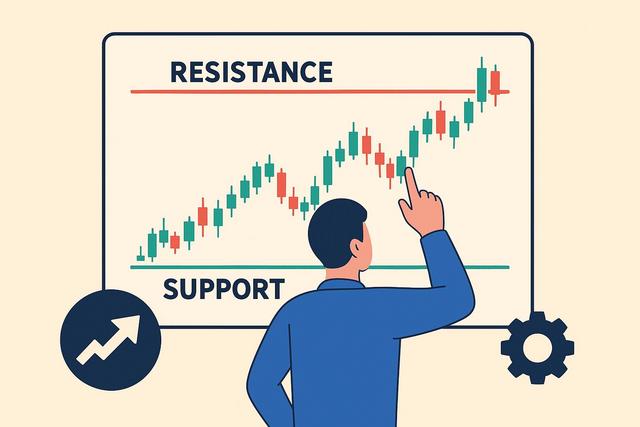
Support and resistance levels are foundational concepts in technical analysis, playing a pivotal role in the decision-making processes of traders and investors across various markets. Understanding these levels provides insights into potential price movements, helps in evaluating market trends, and aids in executing strategic trades with reduced risk. This comprehensive guide explores how to effectively use support and resistance levels, offering practical insights for implementing these strategies in real-world scenarios.
Understanding Support and Resistance Levels
Support and resistance levels are key indicators used in technical analysis to identify price levels a security is unlikely to cross. Support is a price level where a downtrend can be expected to pause due to a concentration of demand or buying interest. Conversely, resistance denotes a level where an uptrend can pause due to concentrated selling or supply pressures.
Example: Consider a stock priced at $50, which repeatedly bounces back each time it touches $45. Here, $45 acts as a support level. Conversely, if the stock struggles to break above $55, this price acts as a resistance level.
Setting Up Your Charts
To identify support and resistance effectively, setting up your charts properly is crucial. Various tools like horizontal lines and trendlines help visualize these levels. Modern trading platforms such as TradingView and MetaTrader offer features to draw these lines easily.
- Use horizontal lines to mark support and resistance.
- Trendlines can identify dynamic support and resistance, indicating ongoing trends.
- Indicators like Fibonacci retracements further aid in identifying these levels.
Types of Support and Resistance
Horizontal Support and Resistance
These lines form when the price repeatedly experiences highs and lows around the same area, clearly visible in sideways markets.
Dynamic Support and Resistance
These are inclined lines drawn through prices that show trending environments. They're not fixed like horizontal lines and change with ongoing price movements.
Scenario: In an ascending channel, the bottom trendline can act as dynamic support, while the top acts as the resistance.
Tools to Help Identify Support and Resistance
Several tools improve accuracy when identifying support and resistance:
- Moving Averages: Smoothens out price data to identify trends visually and can serve as dynamic support or resistance.
- Fibonacci Retracement: Works well for projecting move yields and setbacks based on the Fibonacci sequence.
- Volume Indicators: High volumes at certain price levels may suggest strong support or resistance.
Example Use case:
If a stock consistently bounces off a 200-day moving average (MA), this MA may logically serve as a strong support level.
Developing a Trading Strategy
When planning a strategy around support and resistance, consider:
- Entry points: Buy near support lines and sell near resistance levels.
- Stop Loss Placement: Place stops just below the support level when buying and above the resistance when selling to limit potential losses.
- Profit Targets: Define realistic targets based on the distance between support and resistance levels.
Practical Recommendations:
- Incorporate risk management practices by pre-defining risk-reward ratios.
- Continuously backtest your strategy on historical data to refine your approach.
Mistakes to Avoid
- Ignoring Market Conditions: Support and resistance vary across different markets (bullish, bearish, sideways). Adapt your strategy to the prevailing market.
- Confirmation Bias: Only considering trends evidencing your expectations can lead to suboptimal decisions. Maintain objectivity.
- Over-Reliance on Historical Data: While past trends provide insights, they do not guarantee future price behaviors.
Common Misconceptions
- Misjudging minor market movements as emerging strong support or resistance levels can mislead traders.
- Believing support and resistance are absolute, rather than zones where prices have a higher likelihood of pause or reversal.
Conclusion and Implementation Steps
Understanding and appropriately applying support and resistance levels empower traders to make informed decisions. By setting clear entry and exit strategies and employing tools such as moving averages and volume indicators, traders can potentially enhance trading outcomes. Regular backtesting and disciplined risk management are crucial for steady improvement.
Implementation Checklist:
- Define clear support and resistance zones using tools like trendlines.
- Tailor your strategy to the current market environment.
- Regularly review and adjust your strategy based on market trend observations.
FAQ Section
What makes support and resistance levels break?
- External market factors, such as significant news events or economic changes, can disrupt expected support or resistance levels.
How reliable are support and resistance levels?
- While not infallible, they offer a strong framework for predicting price movements in many market scenarios.
Can support become resistance and vice versa?
- Yes, this phenomenon, known as 'role reversal', happens when prices break through a support or resistance level and the role of the level switches.

